The Relationship Between Oil and Stocks
The Relationship Between Oil and Stocks
Nicolas Colas at Convergex puts out an excellent note every morning. Toady, he describes the long-term relationship between oil and stcks and how they trade. He is what he had to say.
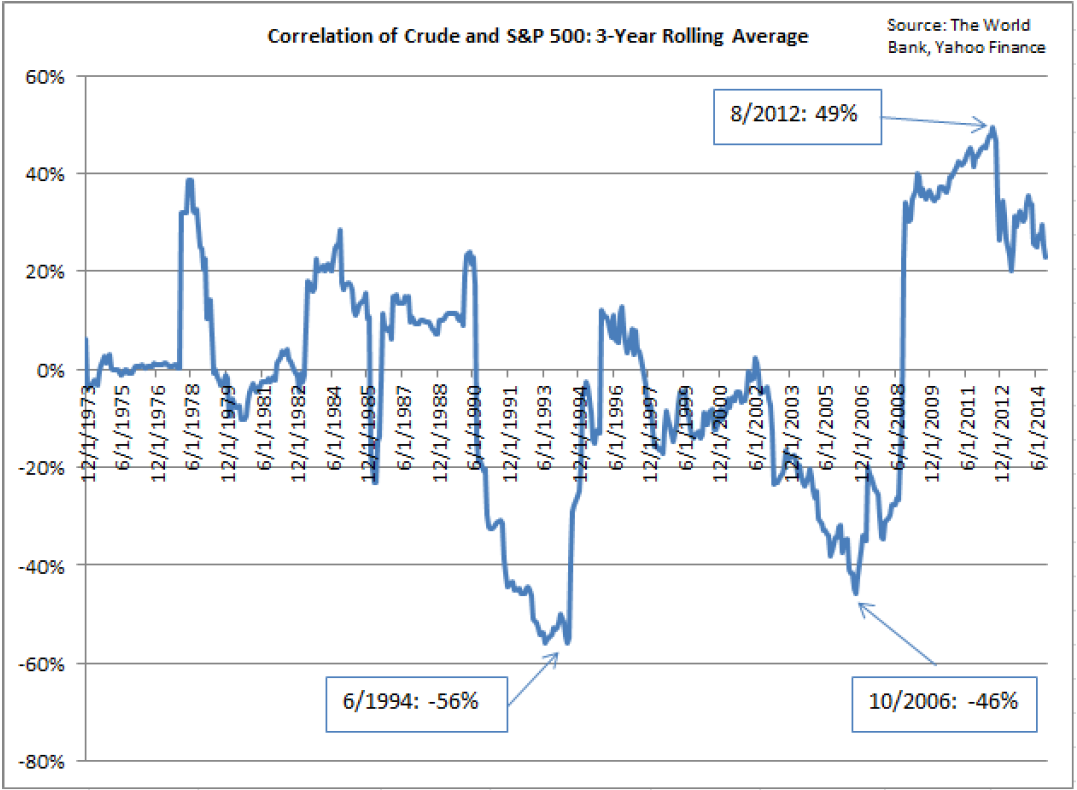
"Going back to 1970, we tracked the 3-year rolling correlations between stocks and oil. There is a chart right after this note, but here is a summary of our findings:
The average correlation for the monthly price moves of the S&P 500 and crude oil prices from 1970 to 2014 is all of negative 1.1%. Essentially zero, in other words.
That said, there are long periods of time when these two asset classes either move largely in tandem or in opposition.
From 1991 to 1994, for example, the average 3-year correlation was negative 44% for the monthly returns of the S&P 500 and crude oil. The peak was negative 56% in June 1994. Another period of similar oil zigs and stock zags was from 2003 to mid 2008, with a negative 46% correlation peak in October 2006. Worth noting: both were periods of nicely positive returns for U.S. stocks.
It should be no surprise that we are coming off an all time (back to 1970, anyway) peak in U.S. stock/crude oil correlations. The all-time high for trailing 3 year correlations was August 2012 at positive 49%, with +6 year string of +20% correlations since October 2008. That is a record. In plain language, we are coming off the single longest streak for relatively high oil/stock correlations in the modern era (i.e. since oil prices started to really move around in the early 1970s).
The upshot of this analysis is clear: what we are witnessing is a very painful divorce between two asset classes that have been together for a long time. That means the volatility in both the stock market and the oil pits is not likely over just yet. The silver lining is that they can – and have historically – do just fine on their own."